Year 8 · Maths · Representing data · Lesson 3
Lines of best fit
Learn to draw a line of best fit on a scatter graph, use it to estimate values in both directions, choose the best line, ignore outliers, and judge when an estimate is reliable.
26-minute video lesson
Teaching, worked examples and 20 practice questions solved step by step.
Watch free for a monthWhat your child will learn
- Draw a line of best fit
- Use a line of best fit to estimate values
- Choose the best line of best fit
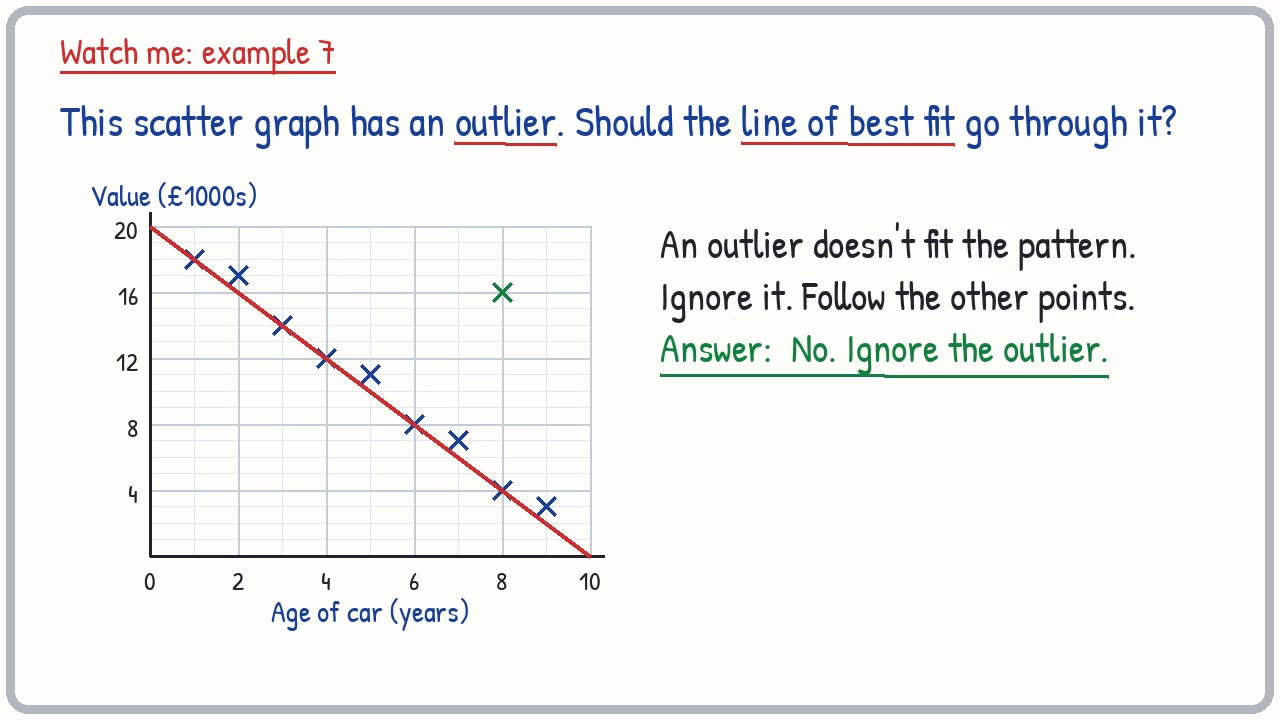
- Ignore outliers when drawing the line
- Decide when an estimate is reliable
The method
- Draw one straight line with a ruler.
- Follow the trend, through the middle of the points.
- Ignore outliers.
- Read estimates from the line, inside the data range.
Key words: line of best fit, trend, estimate, outlier, reliable.
Worked examples
The first three practice questions from the lesson, with every step.
Question 1
Draw a line of best fit on the scatter graph.
- Step 1: Look at the trend
- Step 2: Follow the trend of the points.
- Step 3: About the same above (6) and below (1).
Answer: A straight line through the middle of the points
Question 2
Draw a line of best fit on the scatter graph.
- Step 1: Look at the trend
- Step 2: Follow the trend of the points.
- Step 3: About the same above (4) and below (0).
Answer: A straight line through the middle of the points
Question 3
Draw a line of best fit on the scatter graph.
- Step 1: Look at the trend
- Step 2: Follow the trend of the points.
- Step 3: About the same above (5) and below (1).
Answer: A straight line through the middle of the points