Year 8 · Maths · Multiplicative change · Lesson 2
Conversion graphs
Learn to read and draw conversion graphs for money, distances and lengths, read them in both directions, convert values beyond the graph, and spot direct proportion.
36-minute video lesson
Teaching, worked examples and 20 practice questions solved step by step.
Watch free for a monthWhat your child will learn
- Read a conversion graph in both directions
- Work out what one small square on an axis is worth
- Convert values that are off the graph using proportion
- Draw a conversion graph from one fact
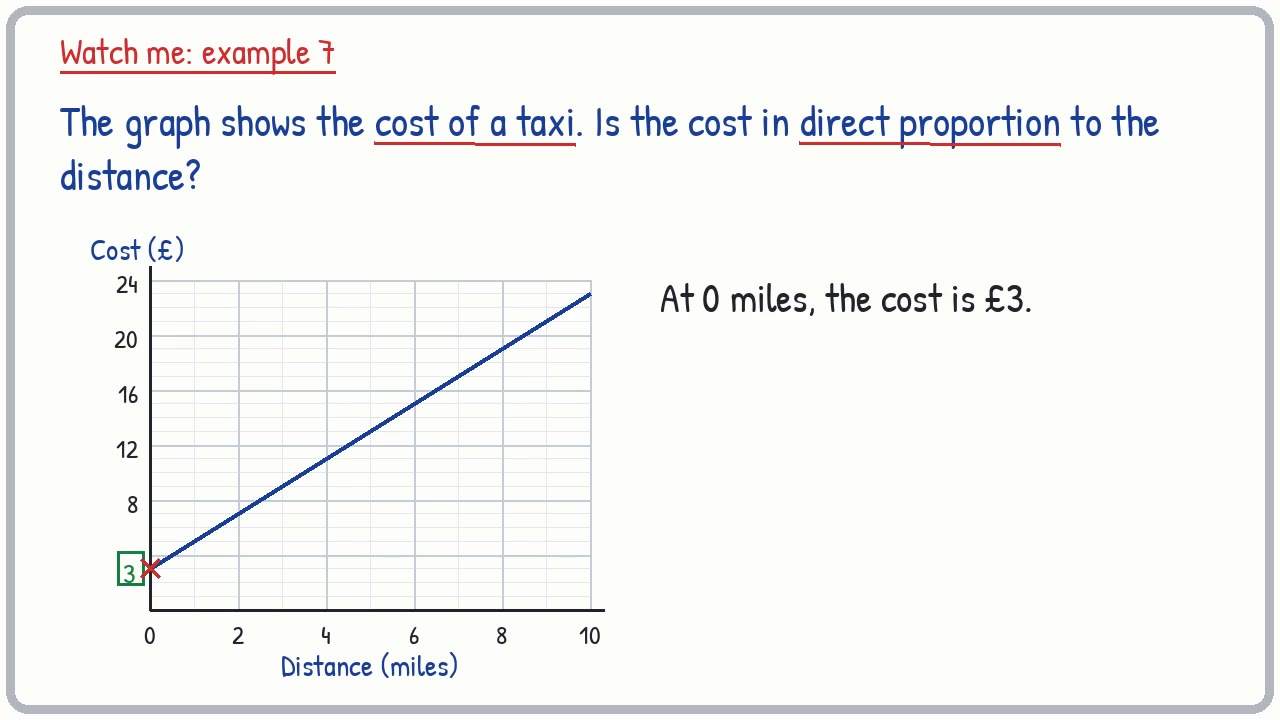
- Recognise direct proportion as a straight line through zero
The method
- Check what one small square is worth on each axis.
- Start on the axis of the unit you have.
- Go straight to the line, then straight across or down.
- Read the value and write the units.
Key words: conversion graph, axis, scale, direct proportion, exchange rate.
Worked examples
The first three practice questions from the lesson, with every step.
Question 1
Use the graph to change £10 into euros.
- Step 1: What is one small square worth?
- Step 2: Start at £10 on the bottom.
- Step 3: Across to €12.
Answer: €12
Question 2
Use the graph to change £45 into euros.
- Step 1: What is one small square worth?
- Step 2: Start at £45 on the bottom.
- Step 3: Across to €54.
Answer: €54
Question 3
Use the graph to change €36 into pounds.
- Step 1: What is one small square worth?
- Step 2: Start at €36 on the side.
- Step 3: Down to £30.
Answer: £30